Tip Of AI
Discover what you can do with AI
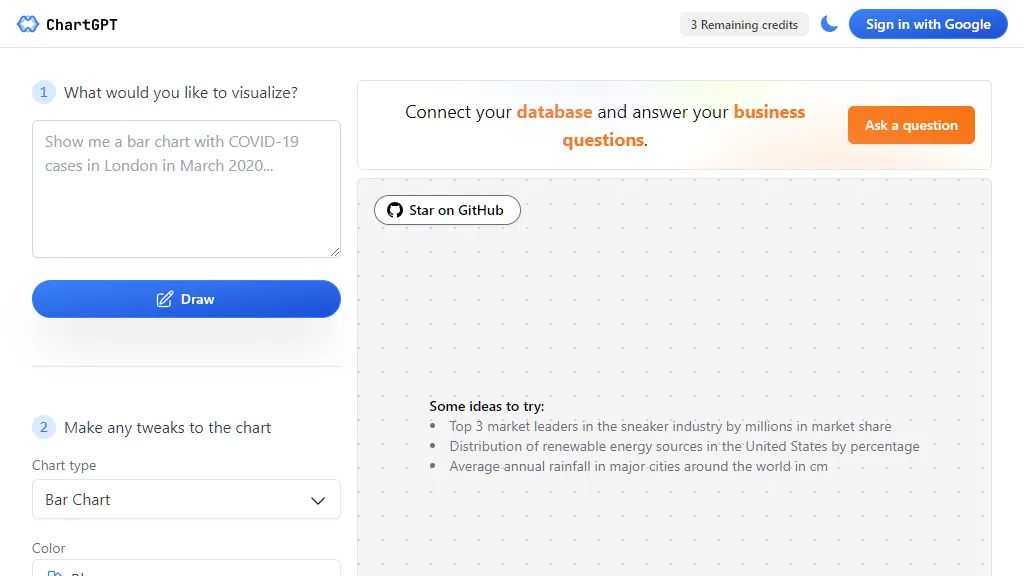
The given text provides a platform or tool that allows users to sign in with their Google account and create visualizations. The tool has various features and options that allow users to customize their charts based on the data they want to visualize. Firstly, users can choose the type of chart they want to create from a range of options including bar chart, area chart, line chart, composed chart, pie chart, scatter chart, radar chart, radial bar chart, treemap, funnel chart, etc. This allows users to select the most appropriate chart type for their data. Secondly, users can make tweaks to the chart by modifying the colors used. The tool offers different color options such as blue, purple, green, pink, yellow, which allow users to customize the chart to their preference or according to their brand colors. Additionally, users have the option to show chart title and chart legend. This provides users with the ability to include necessary information on their visualizations, making it easier for viewers to understand the data presented. The text also mentions the possibility of connecting a database to the tool. By doing so, users can answer their business questions by visualizing the data in their database. This feature allows for deeper analysis and insights. Finally, the text mentions some ideas or examples of the types of data users can visualize, including market share of the top 3 market leaders in the sneaker industry, distribution of renewable energy sources in the United States, and average annual rainfall in major cities around the world. Overall, this tool offers a user-friendly interface with a variety of features and customization options, allowing users to create visually appealing and informative charts based on their data.